Best Counties for Land Investing in Arizona
A data-backed guide for 2026 covering entry prices, water rights, and the one variable that overrides everything.
Arizona's land market is a study in contrasts. Entry prices remain among the lowest in the western United States — rural parcels can still be acquired for under $2,000 per acre — while population growth continues at roughly double the national average. The Phoenix-Mesa-Chandler metro alone added 85,000 residents per year between 2020 and 2024, and statewide numbers crossed 7.58 million in the most recent Census Bureau estimate. Structurally, the fundamentals are strong: no state income tax above 2.5%, no real estate transfer tax, an effective property tax rate roughly half the national average, and a capital gains environment that rewards patient investors with an effective state rate below 2%.
But Arizona also presents a verification challenge that doesn't exist in Florida or Texas — one variable that overrides every other consideration.
Water.
Arizona's water crisis isn't hypothetical or distant. It's actively reshaping where development can occur, which parcels are buildable, and what land is ultimately worth.
Investors who understand this dynamic can find exceptional opportunities in the right counties. Those who ignore it risk acquiring parcels that look cheap for a reason.
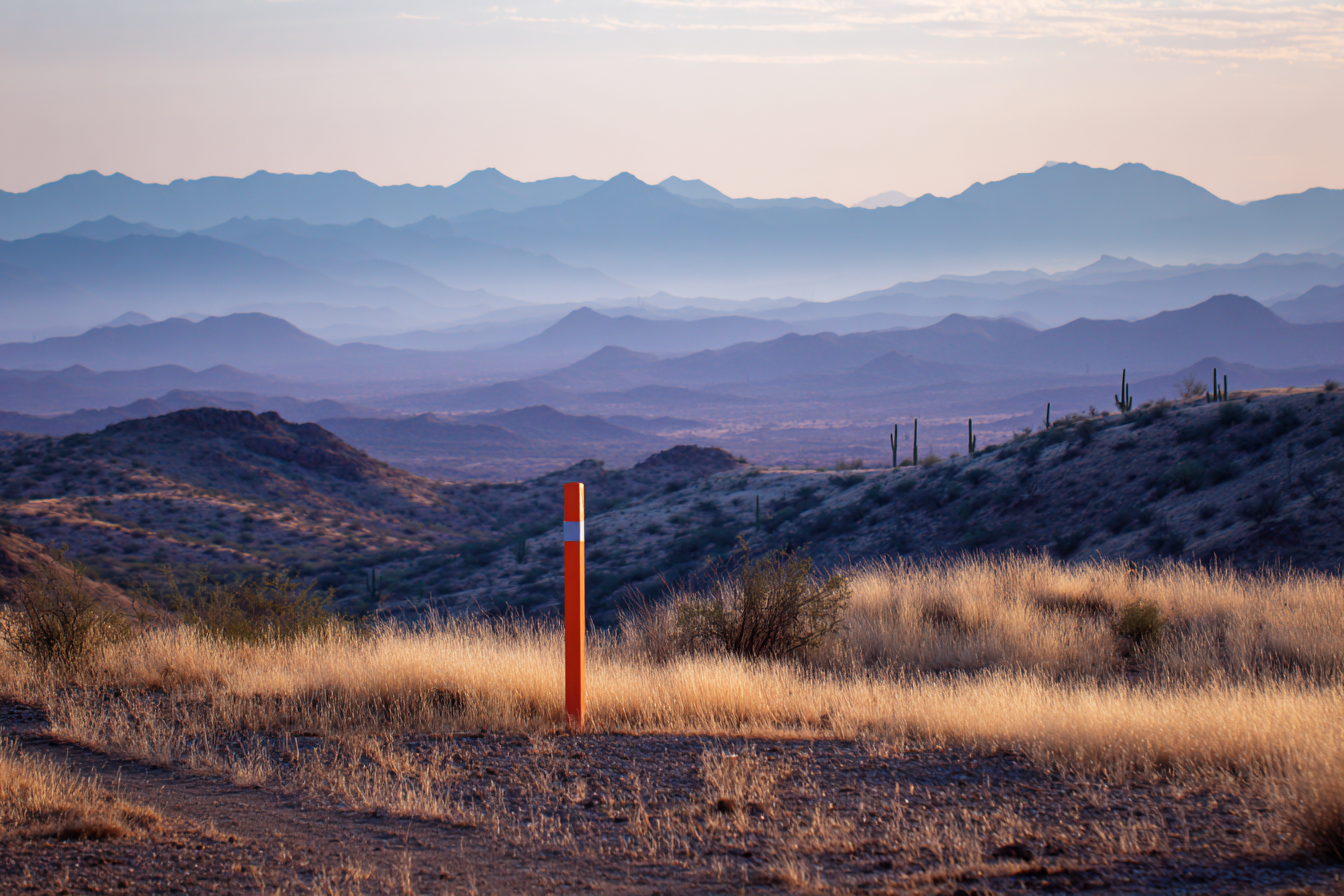
Arizona's Land Market — Concentrated Opportunity in 15 Counties
Arizona has just 15 counties, the fewest of any state in the contiguous West. But the investable land market concentrates further still: meaningful transaction volume, workable margins, and adequate data infrastructure align in roughly 8 to 12 of those counties. The rest are either too sparsely populated to generate consistent buyer demand (Greenlee County has approximately 9,700 residents) or dominated by federal and tribal land with minimal private inventory.
Only about 14% of Arizona's total land area is privately owned. The private land market is, by definition, constrained.
That concentration is worth understanding quantitatively. Federal agencies control roughly 42%, tribal nations hold approximately 27%, and State Trust Land accounts for another 13%. The constrained private market supports pricing in high-demand corridors but also means investors must verify ownership status with more care than in states where private land dominates.
The Evaluation Framework
The county rankings that follow apply the same methodology used in the Florida and Texas guides in this series, with Arizona-specific additions:
Transaction volume — monthly vacant land sales, focusing on cash transactions under $100K. Margin potential — spread between typical acquisition cost and resale price. Data accessibility — quality of county GIS portal, availability of zoning data, ArcGIS REST API availability. Verification complexity — number and severity of common verification issues including flood zones, access challenges, and environmental constraints. Competition level — mailer saturation, number of active investors, and days-on-market trends.
Arizona-specific additions: water availability and Assured Water Supply designations, state trust land adjacency, and tribal land boundary considerations.
Tier 1 — High Volume, Strong Margins, Good Data
Mohave County
Mohave County is Arizona's workhorse for land investors. The county consistently ranks among the top 10 nationally for total land listings — over 3,500 properties representing more than $1 billion in listed inventory as of early 2026. The Kingman–Golden Valley–Bullhead City corridor generates the bulk of this activity, with small lots (0.5 to 2.5 acres) routinely listing between $5,000 and $25,000.
Verification in Mohave is comparatively straightforward. Desert terrain means wetlands are a non-issue for most parcels, and the county operates a functional GIS viewer with parcel data, streets, and aerial imagery. The primary verification pitfall is wash-related flood risk. While the county lacks the coastal floodplain exposure found in Florida, desert washes create localized flood hazard zones that FEMA maps don't always capture. Mohave County's Flood Control District maintains its own wash mapping, and FEMA has issued draft flood maps for Golden Valley and Dolan Springs that expand hazard zones beyond what current panels show. Investors should cross-reference FEMA panels with county flood control data rather than relying on either source alone.
The trade-off: Mohave's high volume means competition is real. Multiple investment firms and mailer campaigns target the county. Margins remain workable but have compressed over the past two years as the county's profile has risen in land investing communities.
La Paz County
La Paz sits at the opposite end of the competition spectrum. With approximately 166 land listings compared to Mohave's 3,500-plus, and a total population of just 16,557, La Paz offers genuinely low competition and affordable entry points. The county's western edge borders the Colorado River near Parker, and listings in that corridor actively market recreation access as a selling point.
Low competition comes with a corresponding trade-off: lower liquidity. The buyer pool is thin, and days on market can stretch considerably. La Paz works best for investors comfortable with longer hold times or those who have established buyer channels for desert recreation parcels. The county's GIS infrastructure is basic — a single web viewer with limited functionality — so verification requires more manual effort than in better-resourced counties.
One development worth monitoring: the Ranegras Plain Basin in La Paz County was designated as Arizona's newest Active Management Area in January 2026, after data showed annual groundwater withdrawals exceeding natural inflows by more than 900%. This designation will impose new pumping restrictions and reporting requirements that could affect agricultural land values and development feasibility in the area over the coming years.
Cochise County
Cochise County's land market is anchored by Fort Huachuca, a major U.S. Army installation hosting the Intelligence Center of Excellence, NETCOM, and over 48 tenant organizations. The base's annual economic impact exceeds $2.9 billion, supporting approximately 21,300 jobs. This military presence creates a steady baseline of housing demand driven by personnel rotation — roughly predictable and largely insulated from broader economic cycles.
However, investors should calibrate expectations carefully. Sierra Vista, the county's primary population center adjacent to the base, has experienced population decline since peaking at approximately 46,500 in 2012. By 2023, the figure had dropped to roughly 44,400 — a 2.1% decline in just three years. Cochise County overall shrank 4.5% over the past decade, making it one of Arizona's fastest-contracting counties by percentage. Fort Huachuca sustains the market; it does not drive growth in the way Phoenix metro spillover drives Pinal County.
For investors, this means Cochise offers stability and manageable verification complexity at accessible price points, but resale timelines may be longer and buyer pools smaller than the military presence might initially suggest. The county also falls within — or adjacent to — the newly designated Douglas and Willcox AMAs (created in 2022 and 2025 respectively), both established in response to severe groundwater depletion. Water verification in Cochise is no longer optional; it's essential.
Tier 2 — Solid Opportunities With Known Challenges
Maricopa County
The Phoenix metro generates enormous vacant land transaction volume. Thousands of parcels are listed at any given time, building permits hit 36,011 homes in 2024, and the county assessor reported vacant land values increasing 5.2% in the most recent assessment cycle. Maricopa County is the 4th most populous county in the United States and ranked first nationally for net migration in 2023–2024.
The challenge is entry cost and competition. Average undeveloped land in Maricopa runs approximately $90,000 per acre — roughly 15 times more than rural Cochise County. The investor pool is deep and sophisticated, margins are thinner on a percentage basis, and the June 2023 groundwater moratorium introduced a layer of regulatory uncertainty that continues to evolve. While new pathways like the Alternative Designation of Assured Water Supply (finalized November 2024) and the Ag-to-Urban water transfer law (SB 1611, effective September 2025) have partially reopened development in the outer suburbs, the regulatory landscape remains dynamic. Parcels in the path of growth but outside municipal DAWS service areas carry meaningful water risk that didn't exist five years ago.
Maricopa makes sense for well-capitalized investors who can absorb higher entry costs and navigate complex verification requirements. For investors building a land business at smaller scale, the county's margins may not justify the capital commitment.
Pinal County
Pinal is Arizona's fastest-growing county and one of the fastest-growing in the nation, adding over 18,000 residents in 2024–2025 alone and crossing the 500,000 population mark. The City of Maricopa (within Pinal County) ranked as the 5th fastest-growing large city nationally; Casa Grande placed 8th. A 3,239-acre master-planned urban core was recently approved for San Tan Valley, and the county launched its first comprehensive zoning revision since 2012 in early 2025. San Tan Valley is simultaneously creating its first-ever zoning ordinance.
That last detail captures both the opportunity and the challenge. Pinal's zoning landscape is genuinely in flux. What's zoned agricultural today may be rezoned for residential or mixed-use development within a few years — creating upside for correctly positioned parcels but also introducing uncertainty that complicates current-state verification. The county sits within the Pinal AMA (one of the original four from 1980), meaning Assured Water Supply requirements apply to all new subdivisions. Investors must verify not just current zoning but water availability and the trajectory of planned infrastructure.
Pinal's GIS system is functional — an ArcGIS-based assessor viewer with an open data portal — but lacks the specialized applications available in Maricopa. Adequate for basic parcel research, but investors should plan on supplemental verification through ADWR water data and county planning records.
Yavapai County
Prescott and the Verde Valley generate consistent demand driven largely by retirement migration. Over a third of Yavapai County residents are 65 or older, with a median age of 55.5. Prescott Valley surpassed 50,000 residents in 2023, and the county grew 7.4% since the 2020 Census.
The terrain-driven verification challenge is real. Elevations range from 1,900 to nearly 8,000 feet, creating significant variation in buildability, septic feasibility, and access conditions across parcels that may be only miles apart. Only about 25% of county land is privately owned, with the balance held by the Forest Service, BLM, and other public entities. Land prices average roughly $23,000 per acre — significantly less than Maricopa but meaningfully higher than Mohave or Cochise.
Yavapai also falls within the Prescott AMA (one of the original four), so Assured Water Supply requirements apply. The county's 12% housing vacancy rate signals substantial seasonal and second-home ownership, which investors can either leverage (targeting the vacation/retirement buyer pool) or treat as a caution flag for absorption rates.
Arizona-Specific Verification Considerations
Water Availability — The Non-Negotiable Check
No single verification factor matters more in Arizona than water. The Assured Water Supply program requires developers within any of the state's eight Active Management Areas to demonstrate a physically, legally, and continuously available 100-year water supply before subdividing and selling lots. Outside AMAs, the parallel Adequate Water Supply program is less restrictive — developers must demonstrate adequacy or merely disclose inadequacy to buyers — but the market implications are similar. Parcels without clear water solutions are increasingly difficult to sell at projected margins, as end buyers and their lenders grow more aware of Arizona's water constraints.
The distinction between Certificate of Assured Water Supply (obtained per-project by individual developers) and Designation of Assured Water Supply (granted to an entire municipal water provider's service area) is critical for parcel valuation. Land within a DAWS service area carries fundamentally different risk than land outside one.
Arizona's AMA map has expanded rapidly. Three new AMAs were designated between December 2022 and January 2026 — Douglas, Willcox, and Ranegras Plain — all in response to severe groundwater overdraft. Investors should verify not only current AMA boundaries but pending designation proposals, as new AMAs can impose pumping restrictions and reporting requirements that affect land use overnight.
Wash and Arroyo Flood Risk
Arizona's flood risk operates differently than in coastal states. Damage concentrates along desert washes and arroyos — typically dry channels that become violent flash flood corridors during monsoon events. FEMA flood maps systematically undercount these hazards. Pima County's Flood Control District has stated publicly that FEMA has mapped fewer than half of known flood hazards in the county, and similar gaps exist statewide. ADWR publishes supplemental state standards for sheet flooding and erosion hazards that go beyond FEMA minimums. Investors who rely solely on FEMA Zone X designations in Arizona are accepting unquantified risk. For a broader look at FEMA map limitations, see how to read a FEMA flood map.
State Trust Land Boundaries
Arizona's State Land Department holds 9.2 million acres — roughly 13% of the state. Trust land is not public land. Entering it without a permit constitutes criminal trespass, and the checkerboard ownership pattern (particularly in northern Arizona) means private parcels can be completely surrounded by trust land with no guaranteed legal access across it. The State Land Department explicitly warns that temporary access permits do not warrant that legal access exists. Investors should verify parcel adjacency to trust land and confirm that legal access routes cross either public roads or recorded easements on private land — never trust land.
Tribal Land Proximity
Twenty-two tribal nations hold reservations across Arizona, covering approximately 27% of the state's land area. Twelve of Arizona's 15 counties contain tribal land. The verification imperative is confirming that a target parcel is fee-simple private land — not allotted trust land, not within reservation boundaries, and not subject to Bureau of Indian Affairs oversight. In areas like the western Navajo Nation, a checkerboard pattern of tribal trust, allotment, BLM, state, and private parcels makes boundary verification essential before any acquisition.
Access in Rural Desert Parcels
Many Arizona parcels are reached by unnamed, unmaintained dirt tracks that cross BLM land, state trust land, or neighboring private property. Physical access — a visible road on Google Earth — does not equal legal access. Arizona real estate attorneys document this as one of the most common and most expensive mistakes in rural land transactions. The state recognizes easements by necessity and private condemnation for truly landlocked parcels, but courts are reluctant to impose easements when any alternative exists. Verifying deeded easements or public road frontage before acquisition is not optional. For a detailed walkthrough of access verification, see our guide on legal access and road frontage.
Data Quality Across Arizona Counties
The quality of county GIS systems varies enormously across Arizona's 15 counties, and this variation directly affects both manual and automated verification workflows.
Maricopa County operates the most comprehensive system in the state, with specialized mapping applications covering parcels, historical aerials dating to 1930, zoning, FEMA floodplains, elevation certificates, and rainfall data. Mohave and Pinal maintain functional GIS viewers adequate for basic parcel research but with fewer specialized layers and some data currency lag. At the other end of the spectrum, La Paz offers a single basic web viewer, and Greenlee's GIS presence is essentially a default template — the most minimal possible implementation.
State-level resources fill critical gaps regardless of county. The Arizona Department of Water Resources (ADWR) provides downloadable GIS data on wells, water rights, land subsidence, and floodplains. The Arizona Geological Survey (AZGS), operated through the University of Arizona, offers a Natural Hazards Viewer covering earth fissures, active faults, and flood potential, plus over 1,000 free reports and maps. The Arizona State Land Department operates a parcel viewer showing all trust land boundaries. And the Arizona Geographic Information Council maintains AZGeo Data Hub as the state's authoritative geospatial repository. For investors working across multiple Arizona counties, these state-level datasets often prove more reliable and consistent than county-by-county GIS portals.
The Bottom Line
Arizona offers land investors a rare combination: low entry costs, strong demographic tailwinds, and a favorable tax environment. But the state's water constraints introduce a verification dimension that simply doesn't exist in Florida or Texas — and that dimension is becoming more consequential, not less, as new AMAs are designated and Colorado River allocation negotiations remain unresolved heading into 2026.
The investors who will do best in Arizona are those who treat water verification with the same rigor they bring to title searches — not as an afterthought, but as the first and most important filter. Counties like Mohave and Pinal offer genuine opportunity for those who verify thoroughly. Counties like La Paz and Cochise offer niche plays for investors who understand their specific dynamics. And Maricopa and Yavapai reward those with the capital and sophistication to navigate complex, fast-changing regulatory environments.
The due diligence checklist that underpins these county assessments — covering environmental, zoning, access, title, and market verification — is available as a downloadable PDF. For investors screening at volume across Arizona's best counties, Land Prowler automates the structured verification checks described throughout this guide, from FEMA panel-level flood data to water availability cross-referencing, delivering pre-qualified parcels rather than requiring investors to navigate each data source manually.
Want to know which Arizona counties Land Prowler currently covers? [Get in touch](#).